Discount upto 50%
Having been in the project management, training and coaching for over last many years, I witnessed that- The histogram is one of the powerful Quality planning and control tool to understand preventive and corrective actions. In a given situation, it shows the different causes of problems. It reflects these frequencies in tabulated adjacent rectangles. The height of the bar or adjacent rectangles analysed further to discover corrective or preventive actions.
As per the PMBOK® Guide Histogram is Define as
A specific form of bar chart used to represent the central tendency, dispersion, and pattern of a statistical distribution
Let’s look at a case study for the Development of Histogram as Quality Control Example:
To make a histogram, we need a check sheet as an input. To get more details about check sheet, please refer to the Blog Check Sheet as a Component of Seven Basic Quality Tool;
As a reference, I am using the same example used in check sheet:
Let’s reiterate the same example used in the check sheet –
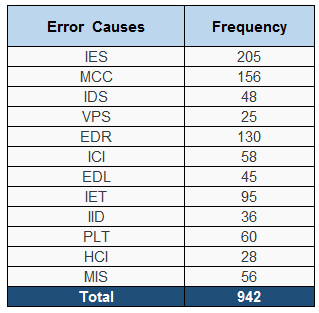
An IT test team member is evaluating work products from specifications to detect problems. Team may choose to categorize data about quality problems in following categories as suggested by Roger S. Pressman:

While examination the work product, test team member assesses the defects and enter frequencies in their respective category of causes like:
Check Sheet suggested by roger s. pressman in software engineering a practitioner’s approach

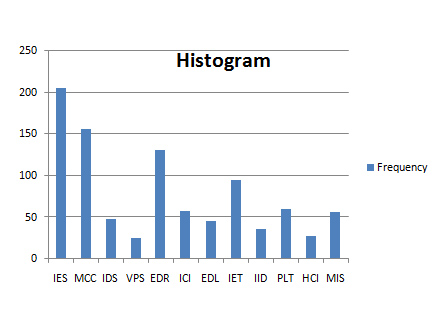
As a further explanation, first two columns are used to develop a Histogram, as shown below:
As mentioned below, using excel we can develop Histogram,

Let’s see usage of Histogram in context of “Plan Quality Management” and “Control Quality” for your The Project Management Professional (PMP)® examination.
| Histogram | Pareto Chart |
| The Histogram is a kind of bar chart showing a distribution of variables or causes of problems. | A Pareto chart is a specific type of histogram that represents the causes of problems by their influence. It is a useful tool to prioritize corrective action as errors with the greatest impact displayed in descending order of frequency. |
| A histogram represents cause of a problem as a column and the frequency of each cause of problem as the height of the column. | In Pareto chat, an arc representing the cumulative percentage of frequencies of causes also included. |
In short, A histogram is a bar chart especially in TQM. It shows the frequency of a cause of a problem occurring where the height of the bar as an indicator of the most affecting reason.
The histogram is one of seven basic quality tool; you can watch and listen to the live video presentation on Seven QC tools here:
Answer: It is a tool to visually represent the causes of problems which are most affecting the given situation. It helps to understand the area which needs your focus to take corrective, preventive actions.
Answer: A histogram is a popular tool to analyze a large amount of data. After analysis, it forms a bar chart to show influential factors in causes problems.
Answer: The histogram breaks up the range of possible values in groups measured in an interval scale. It shows the distribution of data in a convenient form help in discovering appropriate corrective and preventive actions.
Answer: A histogram is a kind of bar chart where the height of the bar shows the frequency of the event. A Pareto chart is a special histogram where data are displayed using 80/20 rule. Here most significant 20% causes are visually presented in descending order of frequency.
You can share your queries and feedback on our discussion Forum. You can also log into our YouTube channel watch the video on the same
Enroll to our FREE PMP® Introductory Program to learn more about PMP® certification
No Trainings found