Discount upto 50%
Cause and Effect diagram also known as Ishikawa Diagram (on the name of the founder) or Fish Bone Diagram as the diagram resembles a skeleton of a fish.
As per the PMBOK® Guide Cause and Effect Diagram can be define as;
A Demonstration technique that helps trace an undesirable effect back to the root cause.
We need tools to prevent and solve problems; emphasis is given to the root of any problem so that problems would never occur (preventive approach) orsurface again (corrective action approach).
Cause and effect diagram is used to facilitate team members to continue pushing back to the root causes of an effect or a problem. Cause and effect diagram is normally combined with 5 why(s) of problem solving where we iteratively brainstorm the cause and effect relationship.
Where it is used
Cause and effect diagram is one of the tools from 7 basic quality tools, and used in “Plan Quality” and “Control Quality as a Tool & Technique. Here my basic objective is to explain the cause and effect diagram in context of these two processes.
In Plan Quality, we need to identify how effectively product will be delivered with the help of identified process improvements.
For instance, lessons learned from similar pastprojects are used as an input to perform planning a quality for the project. If, in case these lessons learned indicates any effect that need to be taken care of, Cause and Effect diagram could be used. The diagram identifies the root of the effect and results in the identification of process improvement activities, quality policies for the processes & work products, metrics to measure performance of work products & processes and help in developmentof quality checklist.

The basic objective of “Control Quality” is to identify the correctness of deliverables and work products are evaluated from the specifications and hence this process helps us to identify causes of poor process or product quality and provide advice to remove them. Cause and effect diagram is an important tool to explore these recommendations.

Here we can see that Cause and Effect diagram can be implied both in preventive approach when used as a tool in Plan Quality and corrective action approach when used as a tool in Control Quality.
When we are in a planning stage, identified effects serve an objective to be achieved and when we are in monitoring then these serve as what deviation we need to remove from the work products and processes.
The process to develop Cause and Effect Diagram:
After identification of the effect, we need to present it to the selected team members and other stakeholders preferably SME(s) to brainstorm the broader categories and subcategories of the causes of the effect.
This effect is presented in terms of problem statement as a head of the diagram to start the identification of the causes of the problem.
Following diagram shows that how ‘effect’ in terms of the problem statement is presented to the selected members during brainstorm session:

A selected group of people brainstorm the broader categories and associated sub categories by discussing continuously “Why,” the Effect, then further “Why” for broader categories and subsequently for sub categories. This is typically 5 Why analysis.
For example Effect and associated broader categories of causes are identified and put it into a Fishbone diagram like:

Note: Here, my emphasis is just to focus towards the steps of development of cause and effect diagram, specific example will be added later
Further subcategories are identified for the broad categories of causes:

This process is repeated until we get the root cause of the problem.
Normally identification of branches for the main arrow of the diagram involves a process of using 5 Why. Number 5 is empirical in nature, means five iterations of asking why is generally sufficient to get the root cause. However, questioning could be taken further to 6, 7, or higher in case more iterations are needed as per the nature of the problem.
Example Root Cause Analysis
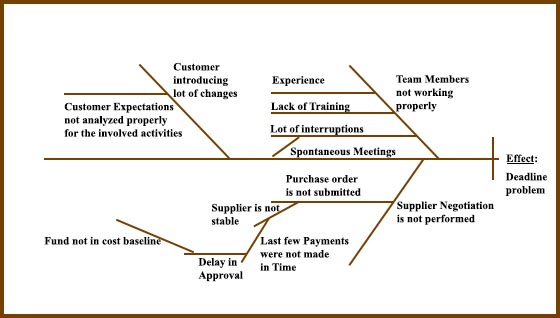
For example effect is identified that we will not be able to meet the deadline because some of the activities have not been completed, by following the aforesaid mentioned process, we can come up with following cause and Effect Diagram:

After analysis of this diagram we need to work on following root causes:
Benefits of Root Cause Analysis
Cause and Effect diagram is an effective tool to avoid surface assumptions of problems and help us to avoid classic answers of problem like not enough time, not enough fund etc.
Problems are resolved in a way that it will not surface again, for example, if we find that we did not get a supply of a pre-requisite tool from a supplier due to non-submission of purchase order then we could resolve it by issuing the same. In future, this problem may surface again if we will not emphasize over including this cost in cost baseline.
In addition this is an effective tool to improve communication within the team.
Cause and Effect diagram also helps to prevent problems as emphasis is given to build quality over inspection.
By now you must have figured out how important cause and effect diagram is to find out the root cause of problems or issues affecting the project.
Cause and Effect diagram is one of seven basic quality tool, you can watch and listen to the live video presentation on Seven Basic Tools of Quality here:
I hope this blog has sufficiently answered your all queries related to Cause and Effect diagram. Good Luck for your PMP® / PMI-PBA® Certification Exam.
You can share your queries and feedback on our discussion Forum . You can also log into our YouTube channel watch the video on the same.
Enroll to our  FREE PMP® Certification Introductory Program to learn more about PMP® certification
Enroll to our FREE PMI-PBA® Certification Introductory Program to learn more about PMI-PBA® certification
No Trainings found